Finding memory leaks in webapps

13 February 2026

Modern web application development often requires a complex network of reactive events which makes it very easy for developers to write JavaScript code which unwittingly holds on to references to objects that are no longer required. Furthermore if working on a Single Page Application the page is seldom reloaded, so this accumulation of objects can continue to grow until the app is closed. Retaining references blocks the garbage collector from freeing the memory used and over time this can become a limiting factor for the performance of your application.

I've recently resolved a significant leak in a webapp, mostly through trial and error. This is an attempt to record what I've learned to make it easier next time.

Finding memory leaks in webapps

Generated by Gemini

Setup

Testing environment

  1. Deploy the app to a production-like environment. Development environments may have additional hooks to refresh the code on change, or additional debug code, which may hold references, and/or complicate the memory snapshot. Deploying locally is ideal because you're going to be rebuilding and deploying frequently to debug this issue so it should be as quick as possible.
  2. Disable extensions (or use incognito mode) as these can interact with the page, adding to the noise, and potentially creating leaks of their own.
  3. Use Chrome's DevTools. Firstly because the tooling in Chrome is the best I've seen, and secondly because that's what the rest of this post is based on.

Take a benchmark

  1. Somewhere near the bottom of the Memory tab you'll see “Total JS heap size” which is dynamically updated as you navigate around the page. If you have an action that you suspect may have a leak, execute it. Now click the little broom icon near the top which encourages the JS engine to collect garbage. Wait a few seconds for the heap size to stabilise and then record the number somewhere.
  2. Now pick a number of repetitions and perform the action again that many times. Garbage collect, and wait for the number to stabilise, then note the difference between the new heap size and the number you got the first time. Divide the difference by the number of repetitions to get a benchmark for how much memory the app is leaking every time the action is performed.

Snapshot of memory usage

Note that this number isn't accurate, which is why you should pick a reasonably large number of iterations, say 10. It may be that subsequent attempts will produce a different number - repeat the steps until you have reasonable confidence in your benchmark.

If you found the heap size reliably increasing, congratulations, you have a leak. Now let's find it!

Finding the leak

Most programmers use AI assistants for what is essentially an advanced autocomplete tool. For example, when given a function definition it will propose an implementation which is then reviewed by the programmer before committing it. Using AI this way means the programmer misses out on understanding the minutia of the implementation, but so long as it's used only for low level functionality it's not likely to contribute to the overall theory. In fact this likely means the programmer can spend more time on higher level considerations, deepening their understanding of the theory. This is similar to invoking a third party library for specific functionality, in that the programmer is intentionally choosing to delegate the details and focus on the theory at a higher level.

  1. First select the Heap snapshot radio button. The other options are useful too but this is the best place to start.
  2. Execute the leaking action once.
  3. Click the garbage collection button, wait for a couple of seconds, then click the Take snapshot button. This takes a dump of memory usage, grouped by object type. So far, for anything other than a trivial application, this is useless. My app has 34,000 strings and there's no way I can figure out which are still useful and which aren't.
  4. Now, pick a smallish prime number. A prime number is useful because you want to detect objects being created some multiple of the number of times you executed the action. 5 is good because it's easy to spot numbers that are a multiple of 5. Do the action 5 times.
  5. You know the drill by now - garbage collect, wait 2 seconds, then take a snapshot.
  6. If you have a leak then you'll see the second snapshot is larger than the first. Select the 2nd snapshot.
  7. Now at the top of that pane there's a dropdown that's currently set to “Summary”. Summary is no good. Change it to “Comparison” to compare with the first snapshot. This shows how many objects have been cleared (# Deleted) and how many have been created (# New).
  8. But what we're interested in is objects that have been created but for which the previous objects have not been cleaned up. To find this, sort by the “Delta #” column and scroll down to find a delta of some multiple of 5 (or whatever number you picked in point 4). These are your leaking references.

Comparing memory snapshots

Fixing the leak

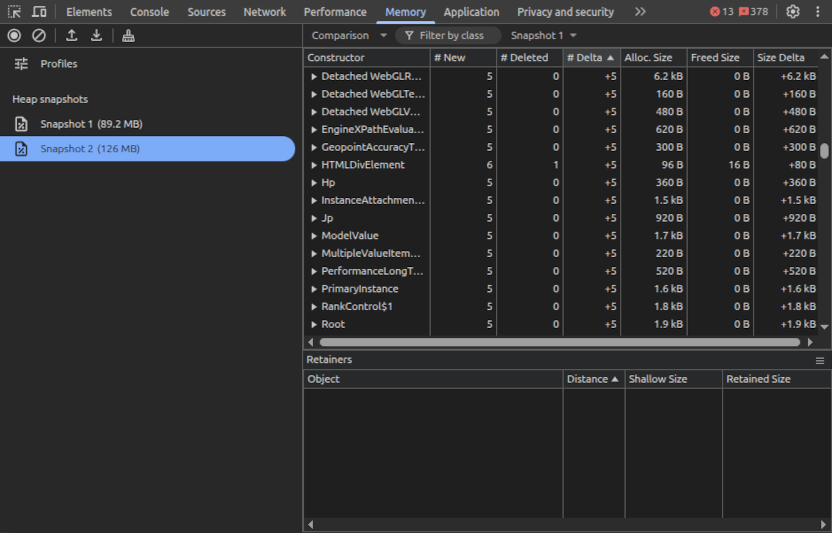
Once you've figured that out, the next challenge is finding the reason why all these objects are not being freed when the new ones are being created. Often these objects refer to each other which is all well and good, but one of them is holding on to a reference longer than it should.

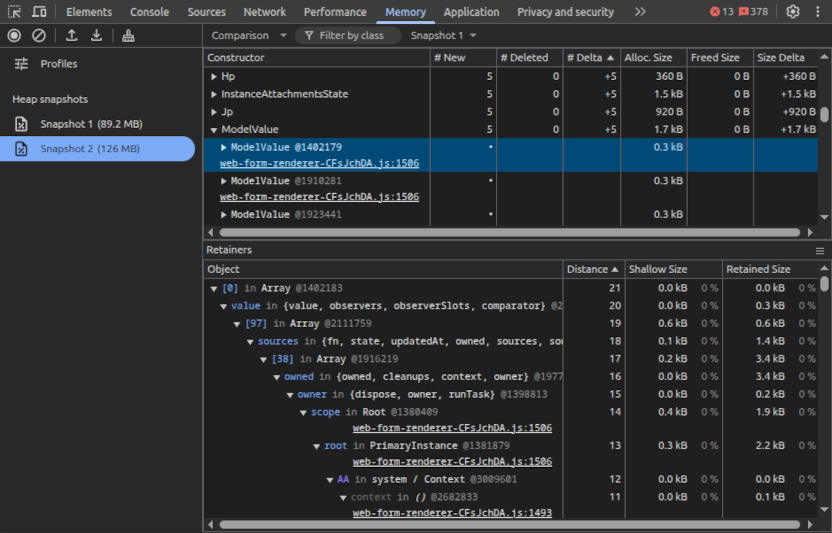
The first step is to select one of the objects that is being held, and you'll see the tree of “Retainers” in the bottom pane. It's going to take a lot of knowledge about your code, and more than a dash of patience, but once you find that one mischievous retainer the whole tree will get cleaned up.

Some key things to look for are caches that never get invalidated, and event handlers that never get deregistered.

Finding memory retainers

Conclusion

Debugging memory leaks is hard. Today's SPAs have thousands of objects with complex relationships which makes it difficult for developers and tools to trace the leaks back to the source.

As for my experience, I found multiple leaks in the form submission of my application.

Fixing these got my memory leak down from 5MB per action, to 200kB which I decided was within the margin of error - issue closed.

To read more, I highly recommend Nolan Lawson's memory leaks post.